
Hong Kong Post has recently been in the spotlight for reporting an operating loss of HK$821 million - the worst results ever in it’s 29 year reporting history.
The resulting operating margin was –32.3% and the net margin was –27.0%.
Postal Operators worldwide have been suffering from rapidly declining letter mail volumes, while at the same time experiencing a large rise in parcel deliveries.
In this article, we are going to look at how Hong Kong Post’s FY2024/25 compares with other developed nation postal operators in APAC.
At a glance
Hongkong Post generated HK $483,521 of operating revenue per employee - below Australia Post, Singapore Post and China Post, but above Japan Post and Pos Malaysia among operators with usable workforce data.
The margins are the sharper warning. Hongkong Post’s operating margin of –32.3% and net margin of –27.0% were the weakest disclosed results in this APAC set.
Australia Post and Singapore Post were profitable, though Australia’s margins were close to break-even and Singapore’s net result included material divestment effects.
Revenue per employee: in the middle of the reported group, but still under pressure
On this measure Hongkong Post’s reported revenue per employee places it fourth out of six. It ranks below Australia Post, Singapore Post, and China Post; and above Japan Post and Pos Malaysia. Revenue per employee is measures how efficient a postal operator is at using it’s employees headcount to generate revenue for the business.
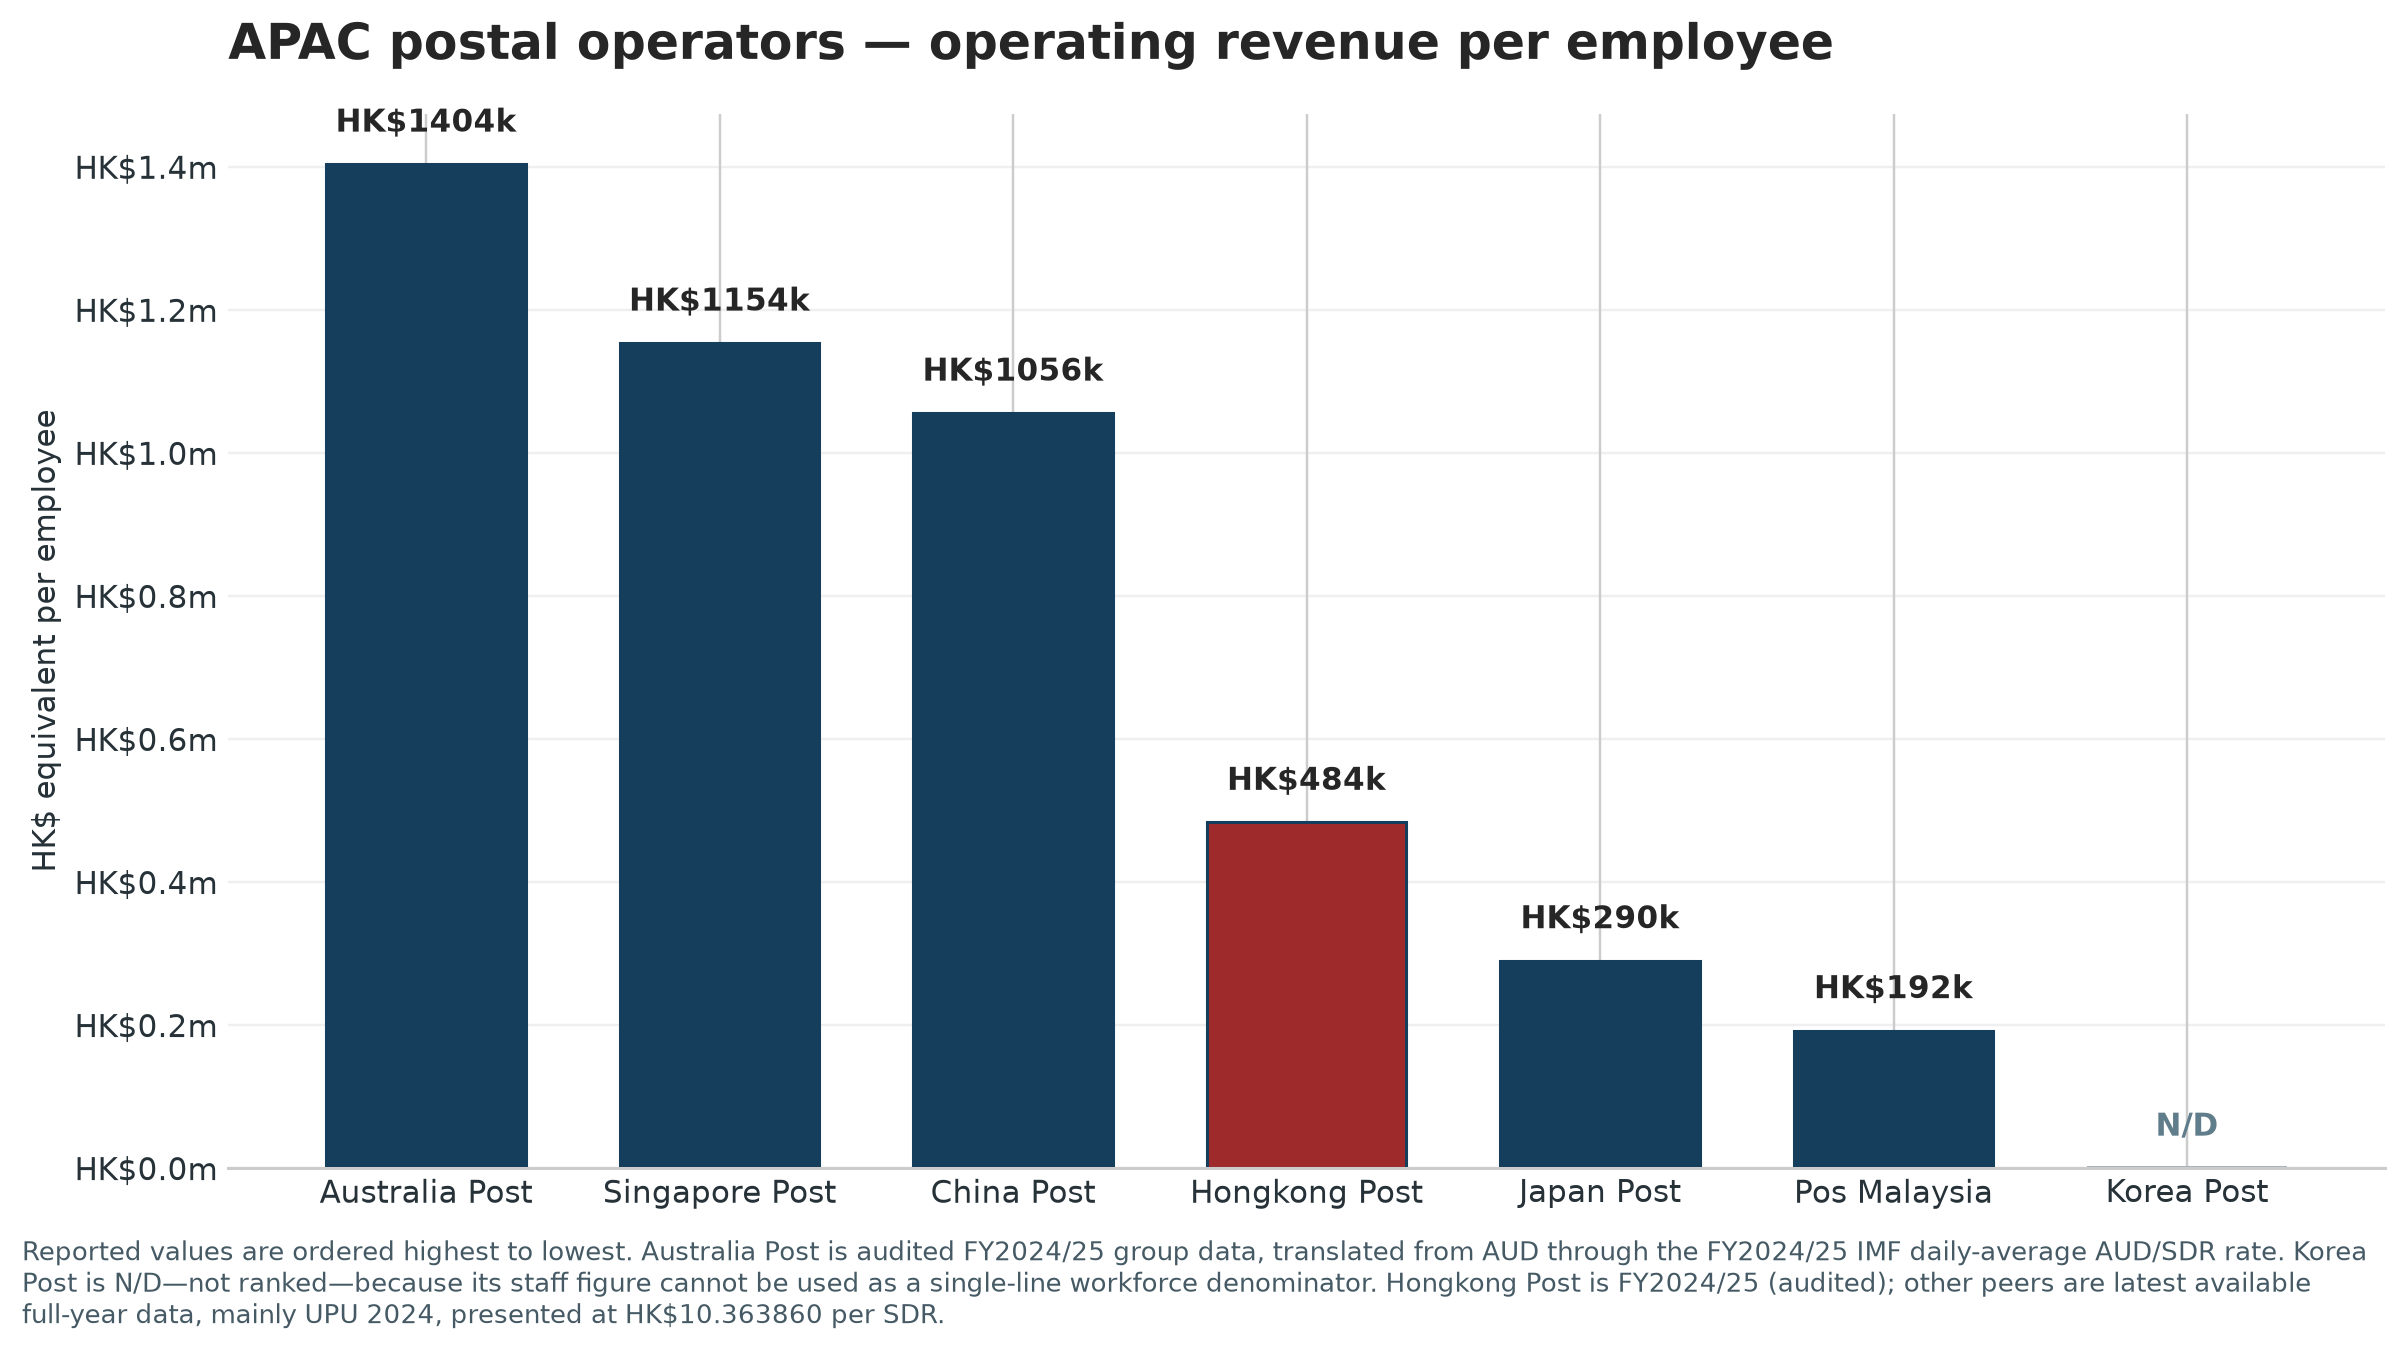
This measure can be slightly misleading without looking at a cost of living adjustment. The value of goods and services in Australia and Singapore are most similar to Hong Kong, while China, Japan, and Malaysia have a lower cost of living compared to Hong Kong. Using the world-bank private-consumption PPP, the story changes slightly:
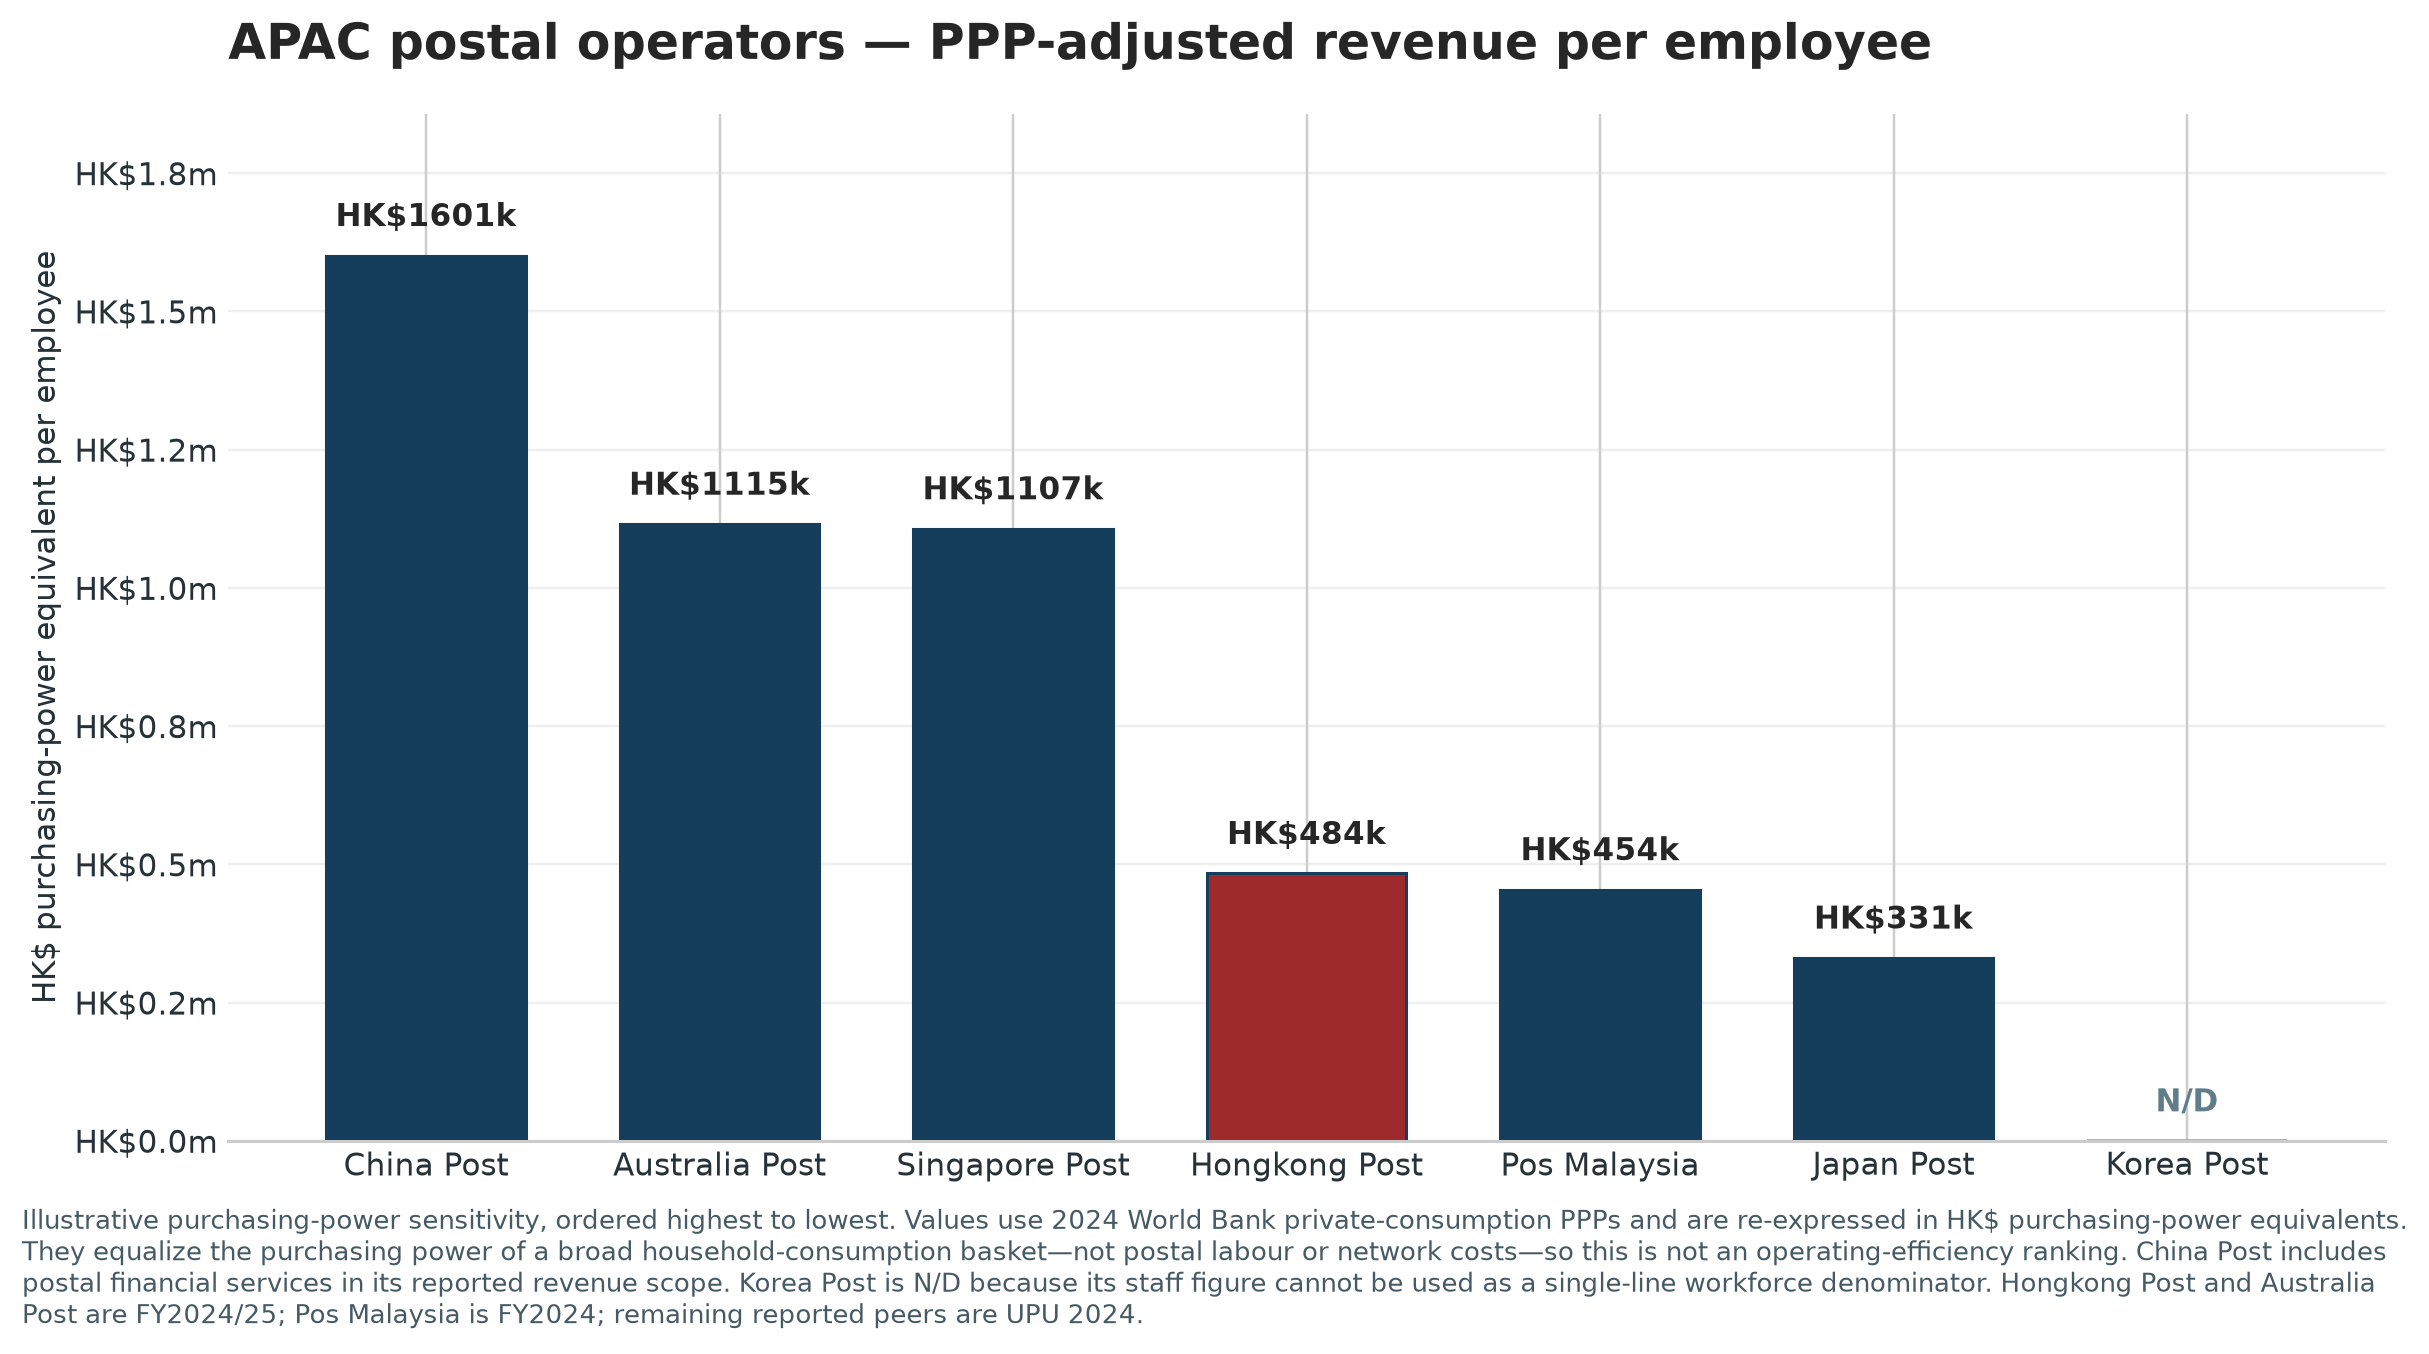
In this case, the chart seems to splinter off into one higher performing group with similar results, and one lower performing group with similar results.
Australia’s leading figure also needs care. It uses 33,951 direct team members, rather than its broader workforce measure of more than 64,000 that includes casuals, contractors and extended-network roles. Normalizing for this, Australia would still product HK$744,725 equivalent per worker which would be 54% higher than Hongkong Post.
That caveat does not change the central finding: Hongkong Post generates less revenue per reported employee than Australia, Singapore and China, and it then turns that revenue into a much larger loss.
Margins tell the sharper story
Hongkong Post’s loss margins are not marginally worse than its available peers. They are materially worse and last in the group.
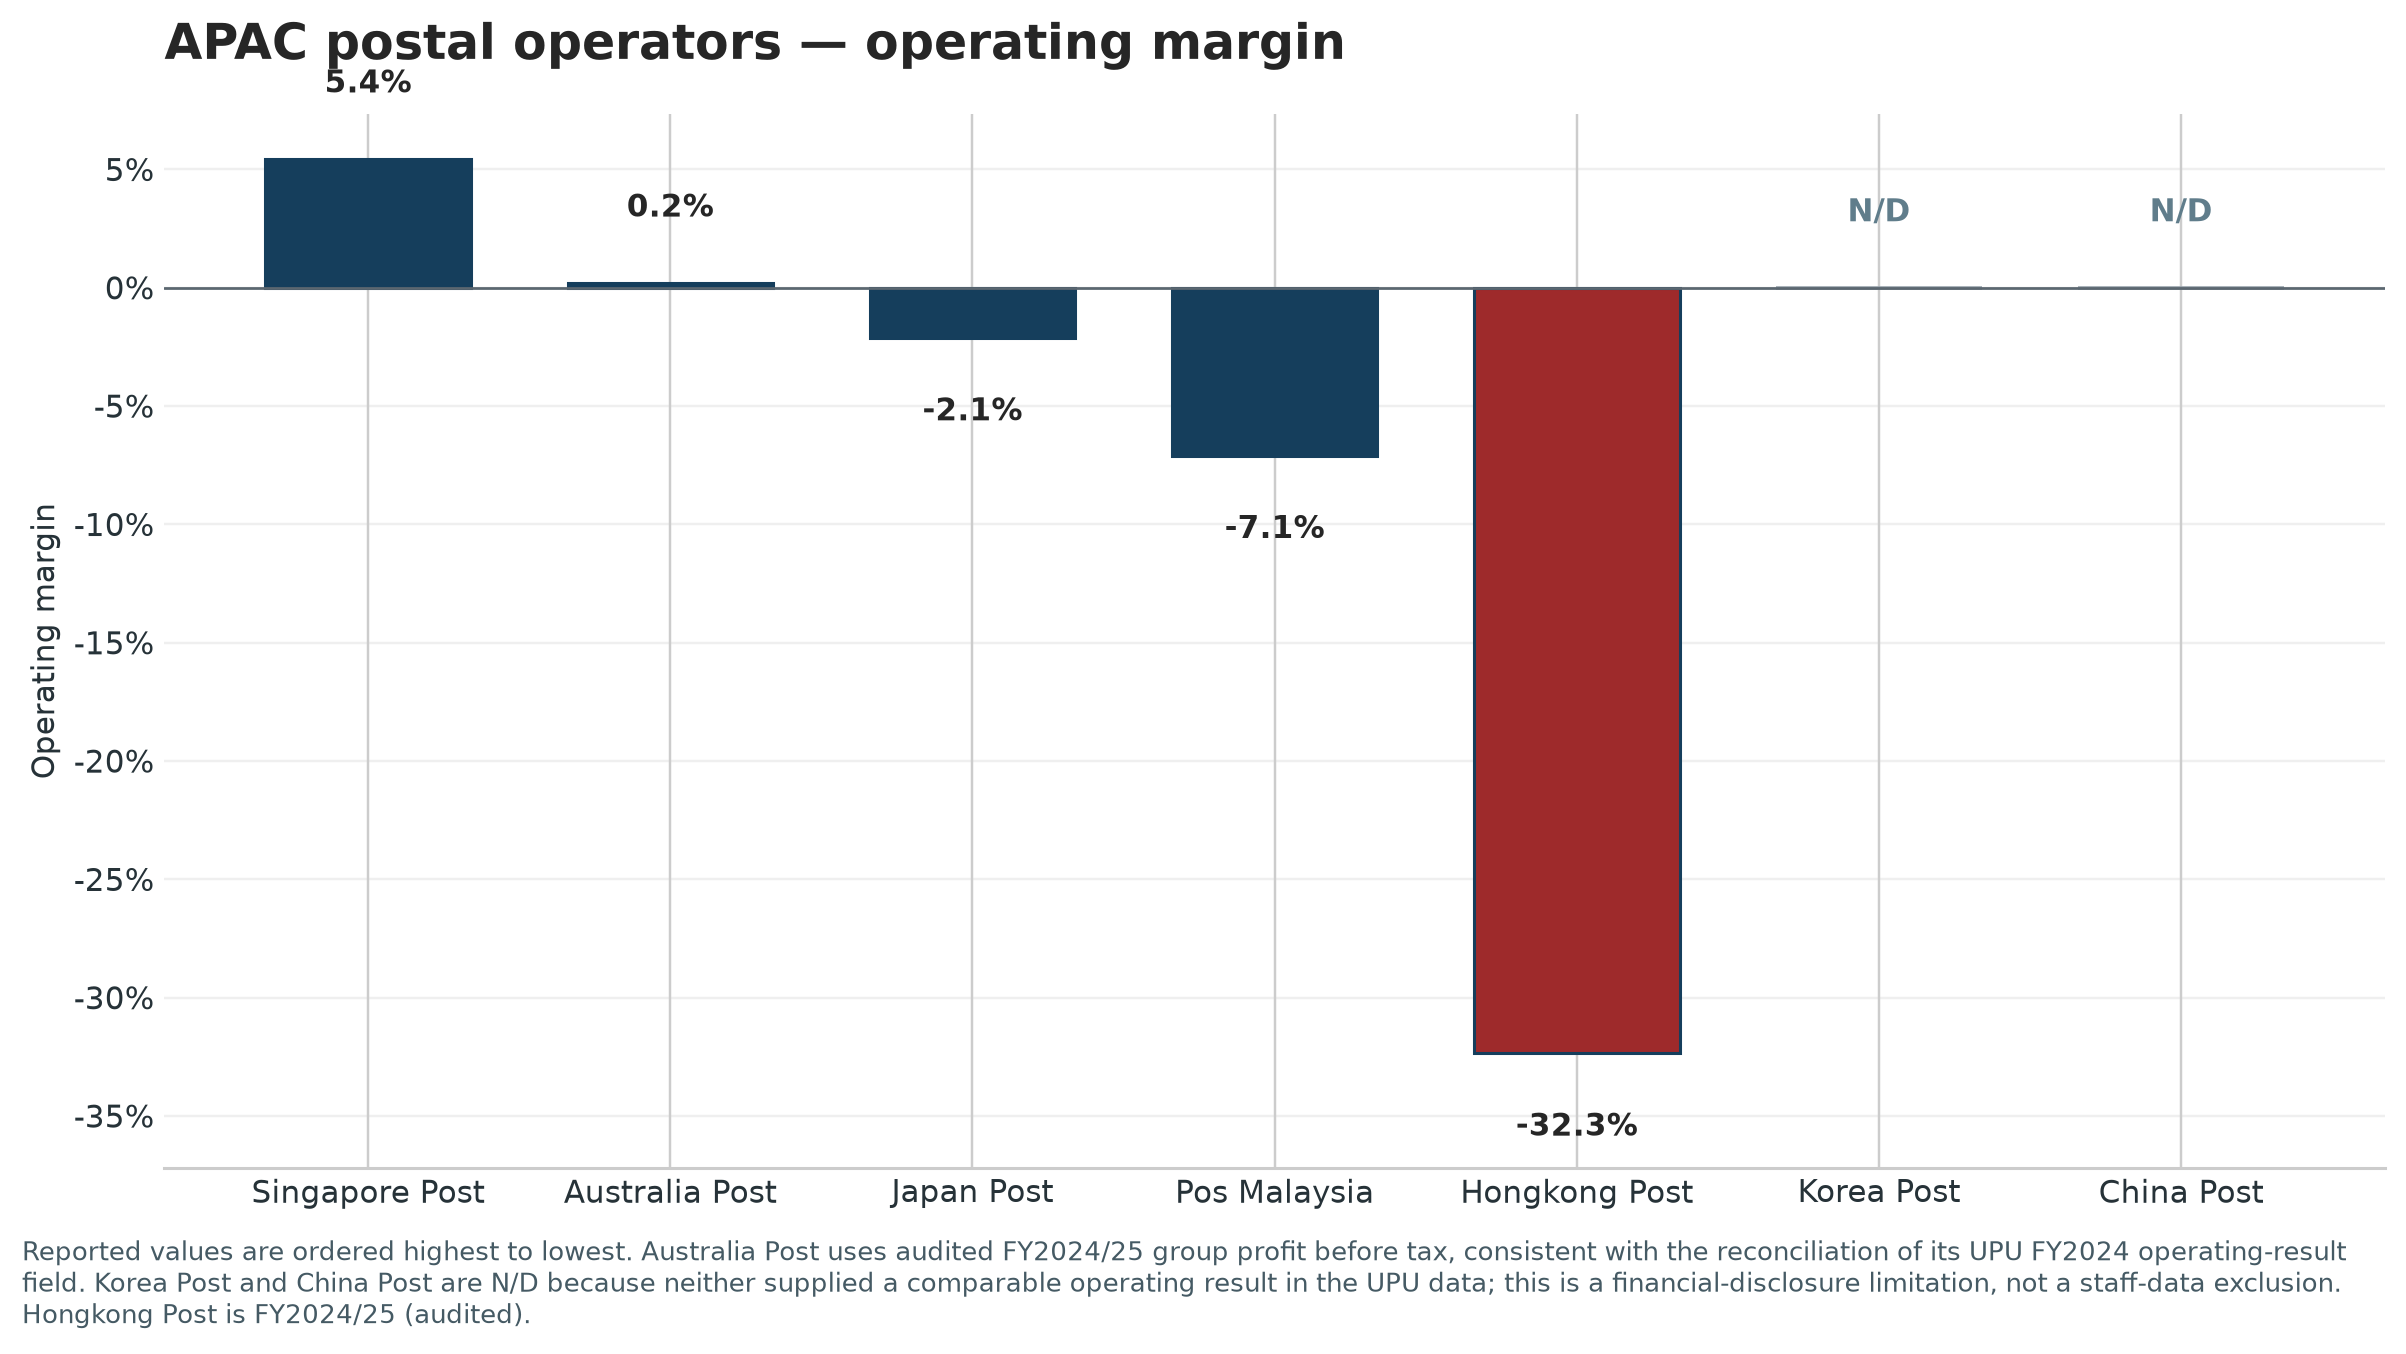
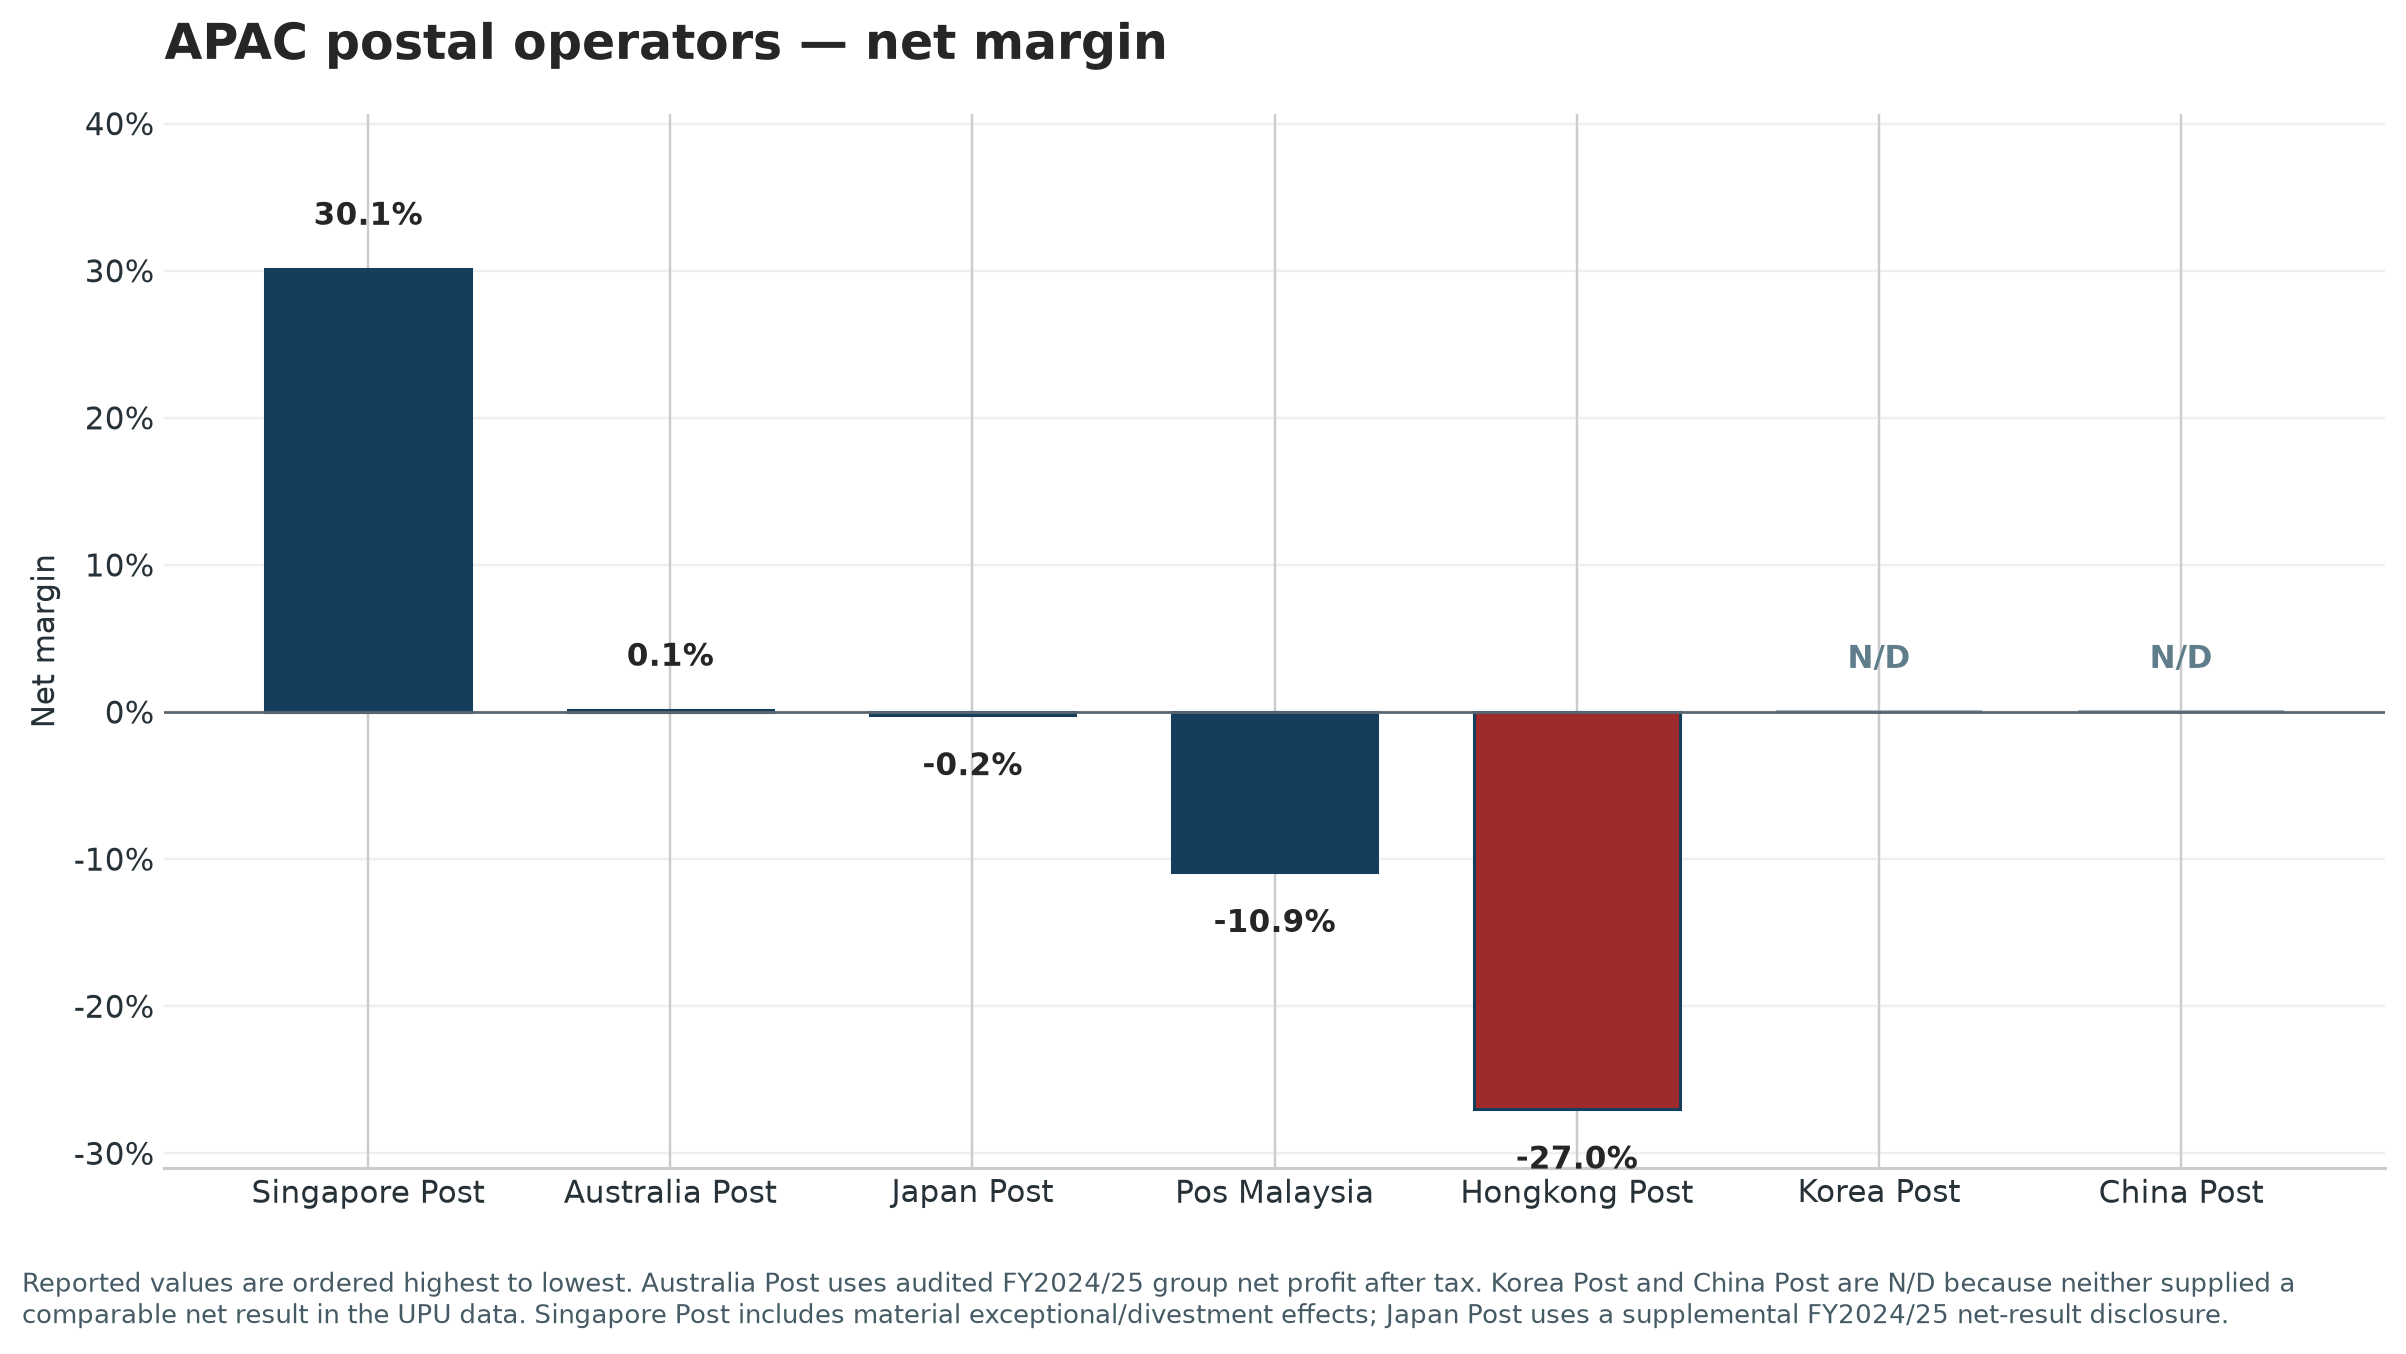
Australia Post’s comparison is especially revealing. It reported a positive result, but its 0.2% operating margin and 0.1% net margin indicate a business close to break-even, not one enjoying a large financial cushion. Singapore Post’s 30.1% net margin should not be treated as a standard postal run-rate because of divestment effects. Even with those qualifications, neither comparison comes close to Hongkong Post’s FY2024/25 loss intensity.
Japan Post and Pos Malaysia also reported losses on the measures available. Yet their operating margins of –2.1% and –7.1%, respectively, were far less negative than Hongkong Post’s –32.3%.
Staff and population size: context, not a simple efficiency score
A postal operator’s workforce and network reflect route density, geography, service standards, retail format, outsourcing, universal-service obligations and the role of postal financial services. For example, China Post, with the largest physical country size, is at a disadvantage with regards to population density servicing dynamics, while Hongkong Post has the greatest advantage.
Measuring network intensity, or how much postal employment is associated with the size of the population served, tells us a one of these stories. While we maintain that this metric is harder to compare, it is based economics that financially the less headcount you can operate with, the better your financial outcome.
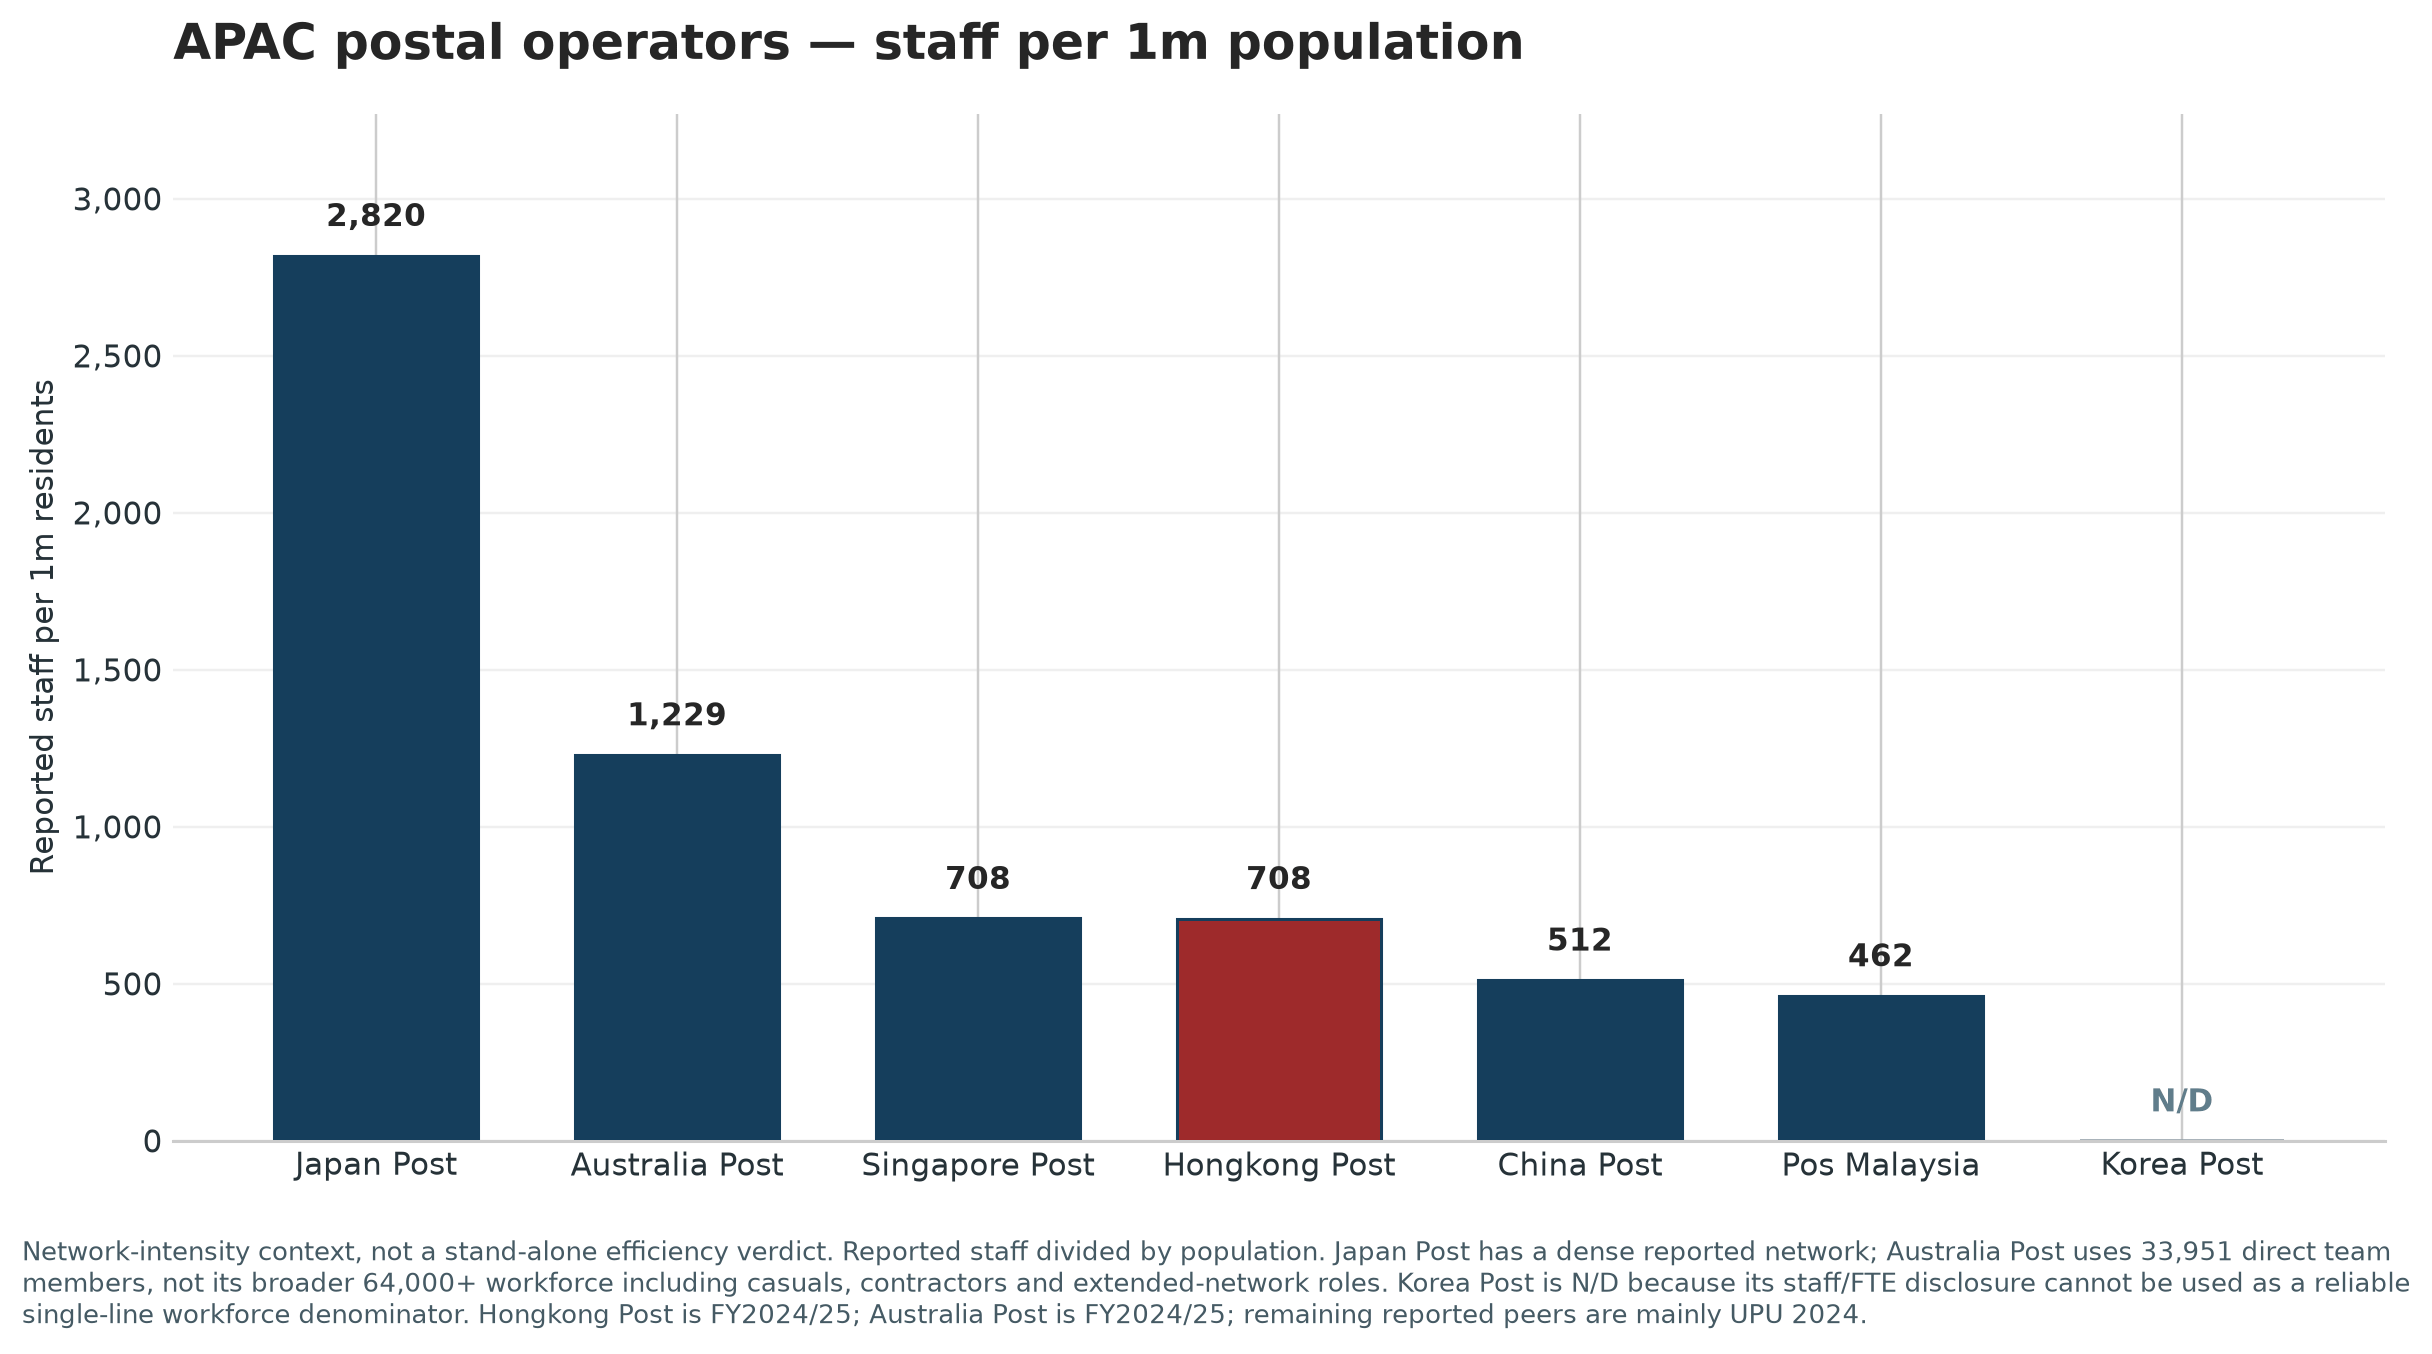
Hongkong Post and Singapore Post each show roughly 708 reported staff per million residents. Australia’s direct-team-member measure is higher, at 1,229 per million residents; Japan’s is much higher, at 2,820. These figures do not prove that one operator is overstaffed and another is efficient. They show why conclusions about headcount need to account for operating design and service obligations.
Looking at population also allows us to observe unit economics. Based on FY2024/25 results, each Hong Kong resident was associated with around HK$342 of operating revenue and HK$92 of annual net loss in.
The takeaway
Hongkong Post’s latest audited loss is not simply a normal feature of being a public postal operator. Its FY2024/25 operating and net margins are substantially more negative than the reported comparable APAC results available here.
It is not last on revenue per employee. But the revenue it generates is plainly not covering its cost base. That gap—rather than headcount alone—is the central financial issue revealed by the audit.
These figures do not identify one cause or a ready-made remedy. They cannot isolate the effect of letter-volume decline, parcel competition, service standards, labour arrangements, property, last-mile geography, cross-border e-commerce or public policy. They do establish the starting point: the financial challenge is severe, and it is visible even after giving the comparison every appropriate caveat.
In our next articles on this series, we will look at:
A brief history of Hong Kong Post’s market dynamics which will help to explain the market forces that shaped how Hong Kong Post went from one of APAC’s highest performing postal operator to the worst
Other Blog Articles on Postal and Universal Postal Union (UPU):
Appendix
Why Korea and China are marked N/D where the data do not support a calculation.
Neither operator is being quietly removed. The discipline is simple: use the data that are disclosed, and do not invent precision where it is not.
Korea Post
Korea Post’s disclosed 2024 postal-business revenue is retained as context. But its workforce data do not support a credible single denominator for revenue-per-employee or staff-per-population. The UPU profile reports 42,858 total staff but only 3,336 FTE posts, exactly the same figure as its number of permanent post offices. Rather than choose a denominator that could be wrong by an order of magnitude, Korea is marked N/D for staff-based measures.
Korea is also N/D for operating and net margins because comparable operating and net-result figures were not disclosed in the UPU profile or the available English-language annual report. N/D is a disclosure limitation, not a judgement on the operator’s performance.
China Post
China Post provides enough UPU data to appear in the revenue-per-employee comparison. But the same submission does not disclose operating expenditure, operating result or net result. Without those inputs, operating and net margins cannot be calculated responsibly. China is therefore N/D in the margin comparison rather than placed at the bottom or omitted altogether.
Sources
Hongkong Post Annual Report 2024/25—financial performance and the full annual report.
Australia Post Annual Report 2025; Singapore Post Annual Report 2024/25; Pos Malaysia Annual Report 2024; Korea Post Annual Report 2024; and Japan Post financial results, year ended 31 March 2025.
Comparability note: Hongkong Post is FY ended March 2025; Australia Post is FY ended June 2025; most remaining UPU figures are calendar 2024. UPU figures are presented in HK$ equivalents at HK$10.363860 per SDR. This is a directional APAC comparison, not a single accounting consolidation.